
Profiling Go HTTP service with pprof and expvar
In this article I am going to show how to profile http service and expose public variables such as operation counters for debugging. We will take advantage of two packages:
- net/http/pprof
Package pprof serves via its HTTP server runtime profiling data in the format expected by the pprof visualization tool. The package is typically only imported for the side effect of registering its HTTP handlers. The handled paths all begin with
/debug/pprof/. - expvar
Package expvar provides a standardized interface to public variables, such as operation counters in servers. It exposes these variables via HTTP at /debug/vars in JSON format. The package is sometimes only imported for the side effect of registering its HTTP handler and the above variables.
Debug middleware
Lets create a simple middleware for our server to expose some counters which we can debug later via expvar handler.
We want to count number or requests and the number of active goroutines.
// m contains the global program counters for the application.
var m = struct {
	gr  *expvar.Int
	req *expvar.Int
}{
	gr:  expvar.NewInt("goroutines"),
	req: expvar.NewInt("requests"),
}

// Metrics updates program counters.
func Metrics(next http.Handler) http.Handler {
    fn := func(w http.ResponseWriter, r *http.Request) {
        next.ServeHTTP(w, r)

        // Increment the request counter.
        m.req.Add(1)

        // Update the count for the number of active goroutines every 100 requests.
        if m.req.Value()%100 == 0 {
            m.gr.Set(int64(runtime.NumGoroutine()))
        }
    }

    return http.HandlerFunc(fn)
}
Debug server
We will create separate server instance, that is going to be run only in debug mode. We don’t want to run it at all times.
Our debug server will expose two routes:
/debug/pprofadded to the default mux by importing thenet/http/pprofpackage./debug/varsadded to the default mux by importing theexpvarpackage.
import (
	"net/http"
	_ "expvar" // Register the expvar handlers
	_ "net/http/pprof" // Register the pprof handlers
)

type DebugServer struct {
	*http.Server
}

// NewDebugServer provides new debug http server
func NewDebugServer(address string) *DebugServer {
	return &DebugServer{
		&http.Server{
			Addr:    address,
			Handler: http.DefaultServeMux,
		},
	}
}
Usage
After having our middleware and server done, we can use it as follow:
package main

var isDebug = os.Getenv("DEBUG") != ""

func main() {
	mux := http.NewServeMux()
	mux.HandleFunc("/", func(w http.ResponseWriter, req *http.Request) {
		fmt.Fprintf(w, "Welcome to the home page!")
    })

    httpServer := &http.Server{
        Addr:    ":8080",
        Handler: Metrics(mux), // wrap our server with metrics middleware
    }

    go func() {
		log.Fatal(httpServer.ListenAndServe())
    }()

	if isDebug {
        debugServer := NewDebugServer(fmt.Sprintf("%s:%d", "localhost", 6060))

		go func() {
			log.Fatal(debugServer.ListenAndServe())
		}()
	}
}
Counters
To see exported counters open http://localhost:6060/debug/vars in your browser.
{
  "cmdline": [
    "/var/folders/_4/81_0n4l57_scy27jfcxx1j300000gn/T/go-build888334884/b001/exe/main"
  ],
  "goroutines": 0,
  "requests": 3,
  "memstats": {...}
}
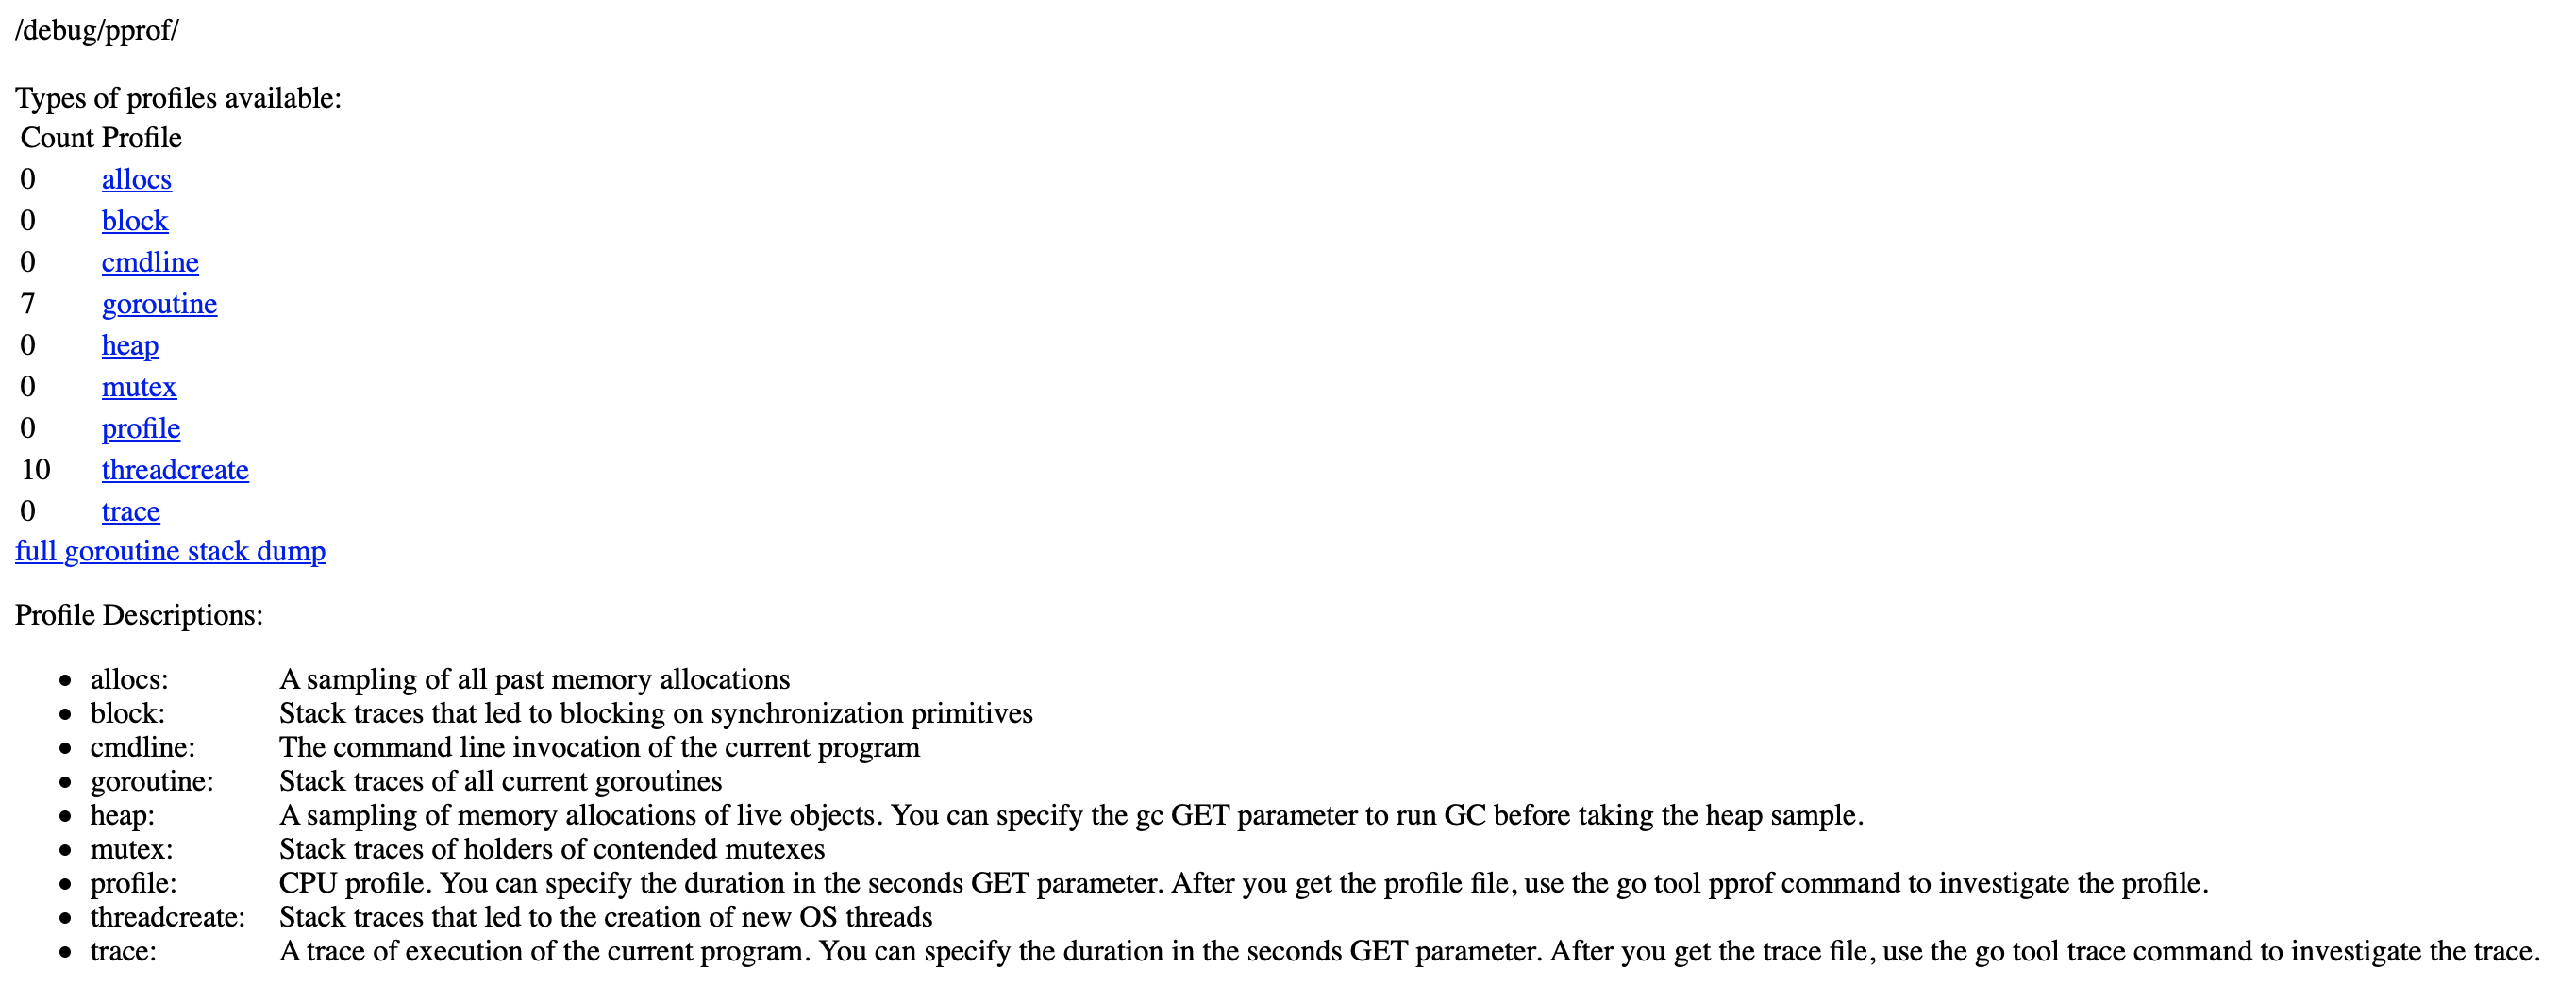
pprof
To view all available profiles, open http://localhost:6060/debug/pprof/ in your browser.
We can see visualization using go tool as follow:
go tool pprof http://localhost:6060/debug/pprof/heap
To see graph in browser lets type web
(pprof) web
failed to execute dot. Is Graphviz installed? Error: exec: "dot": executable file not found in $PATH
If you see error you can install it with:
brew install graphviz
Repeat the sequence:
go tool pprof http://localhost:6060/debug/pprof/heap
(pprof) web
This will open browser with nice graph.

Each box in the graph corresponds to a single function, and the boxes are sized according to the number of samples in which the function was running.
You can read more about profiling Go programs on the go blog.
Conclusion
Most of the times we do not want to run debug server on production instance but there are times that we really need to see what is going on under the hood. Simply toggling environment flag allows us to quickly turn on debug server. This easy way we can enable or disable debug server instance and get access to detailed information about our application. Full code snippet available here